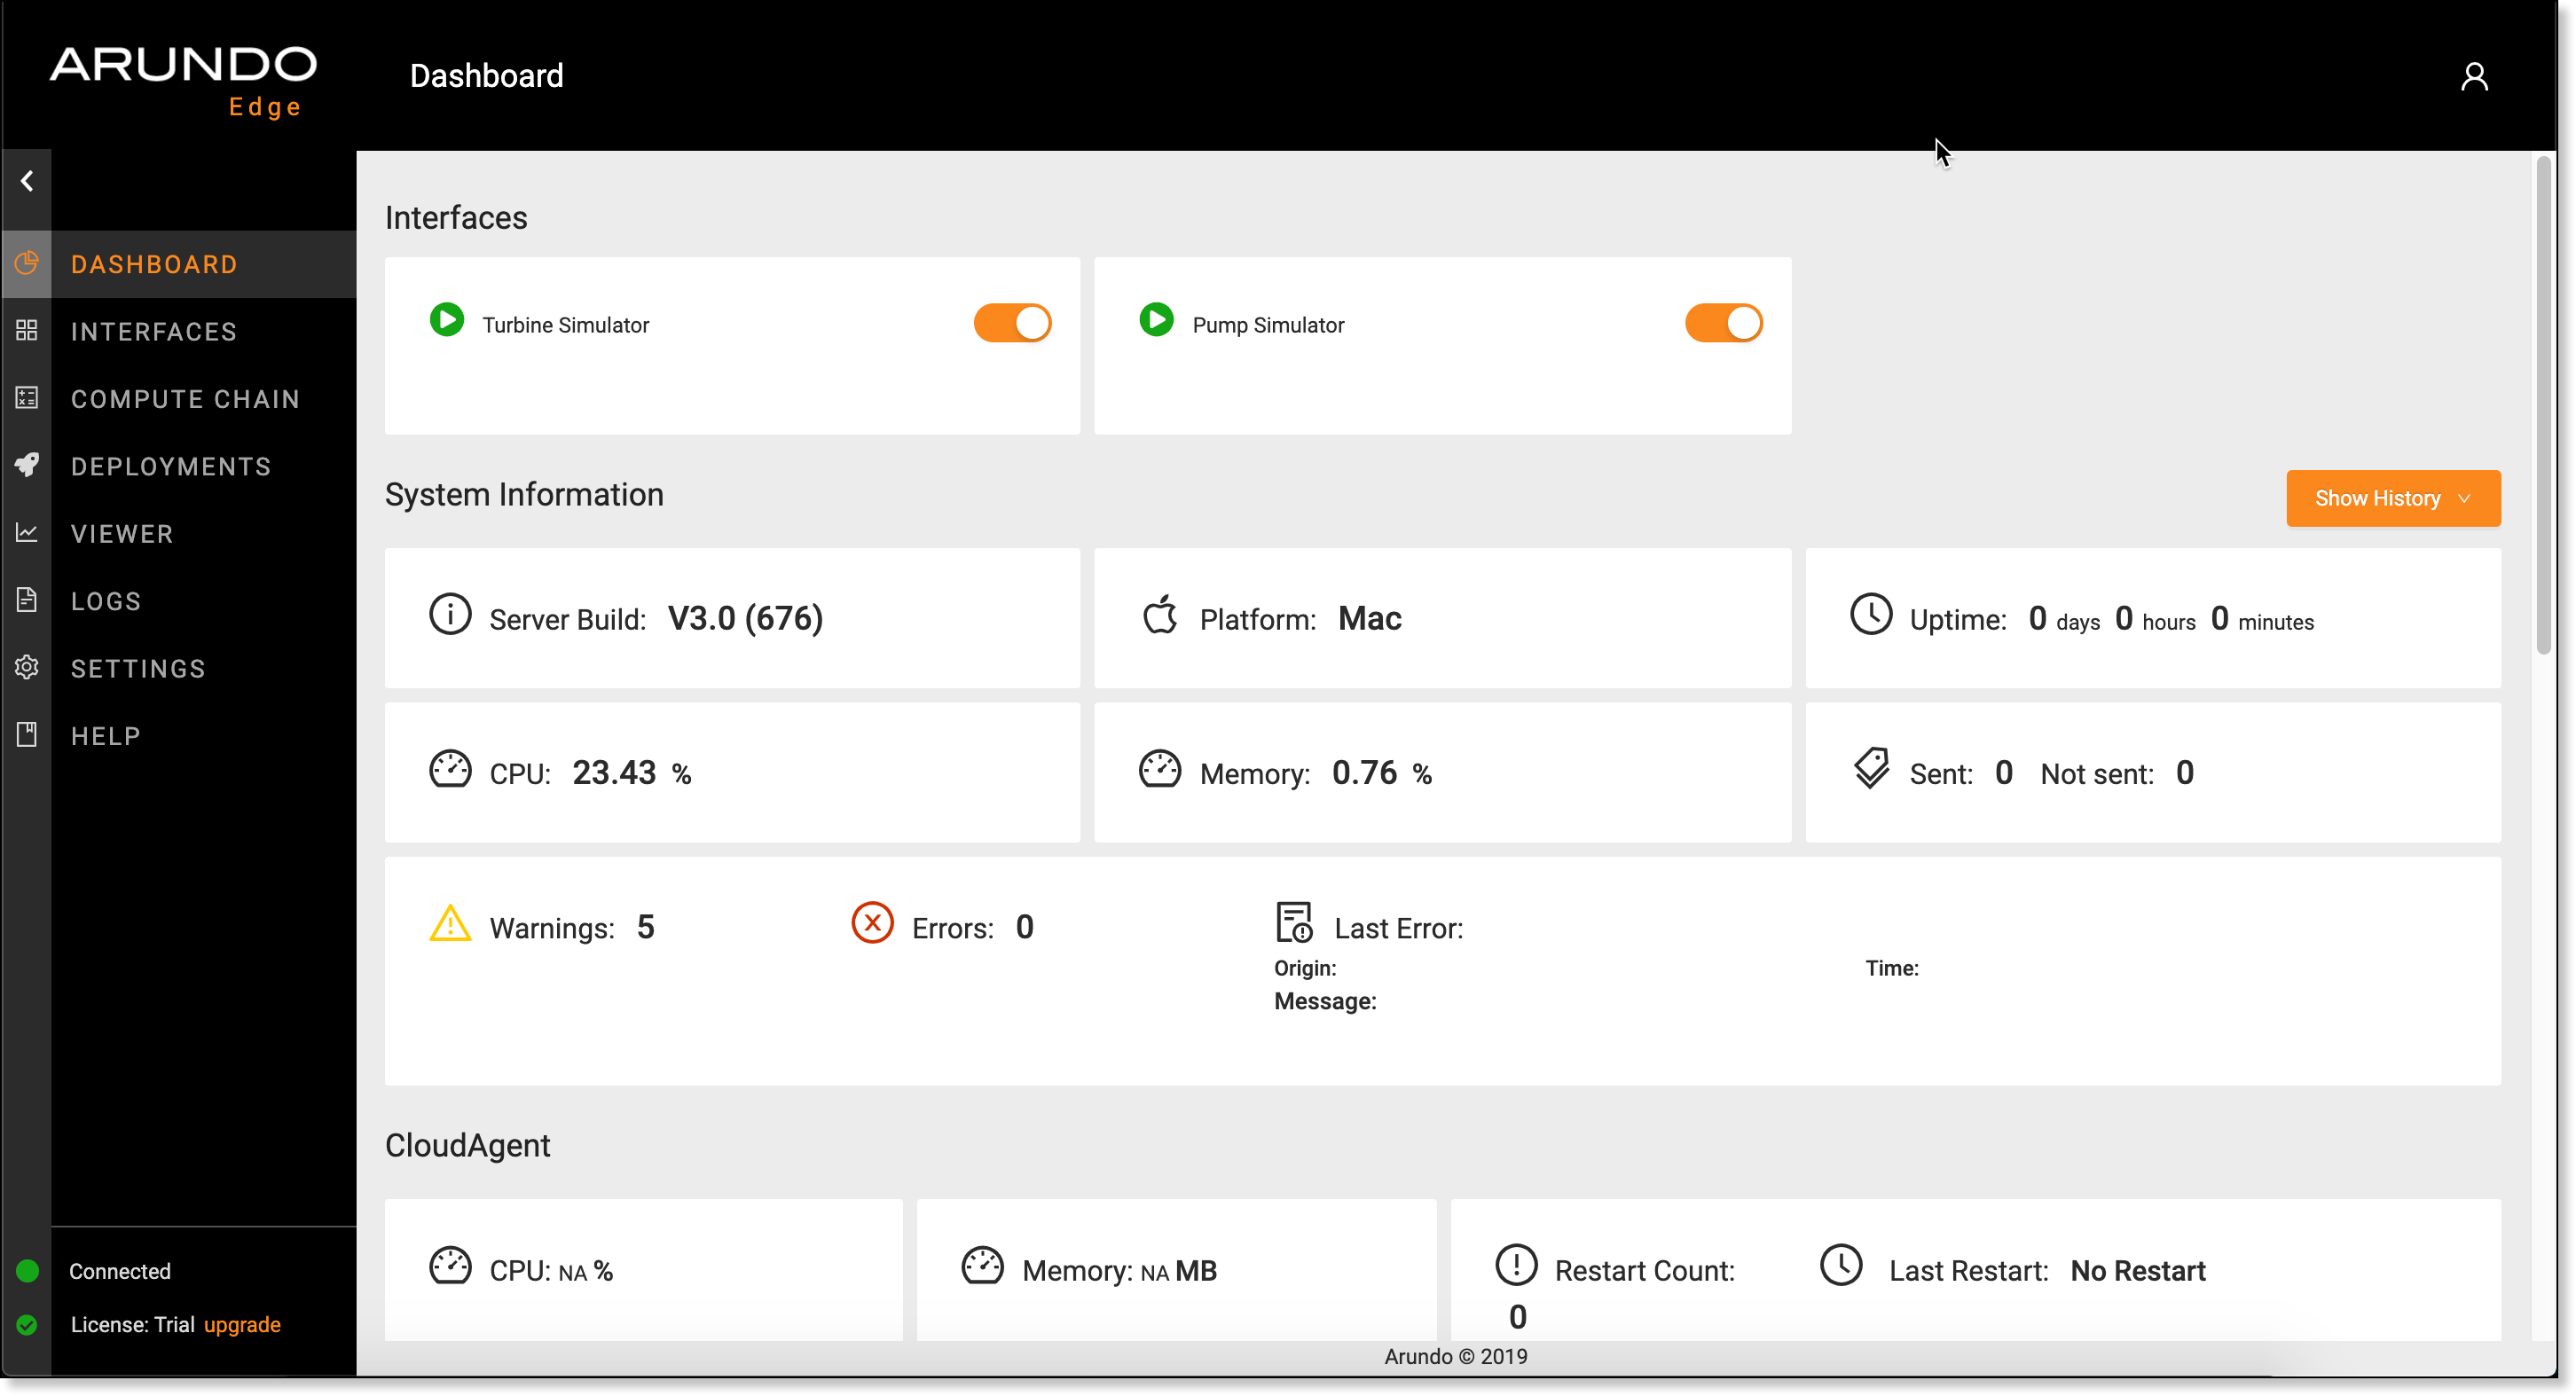
Dashboard

The Dashboard displays the status of interfaces and real-time performance metrics.
Getting There
Log in to Arundo Edge or select Dashboard on the sidebar.
Interfaces Panel
The Interfaces panel displays the status of connections to industrial control systems, cloud environments, and simulators.
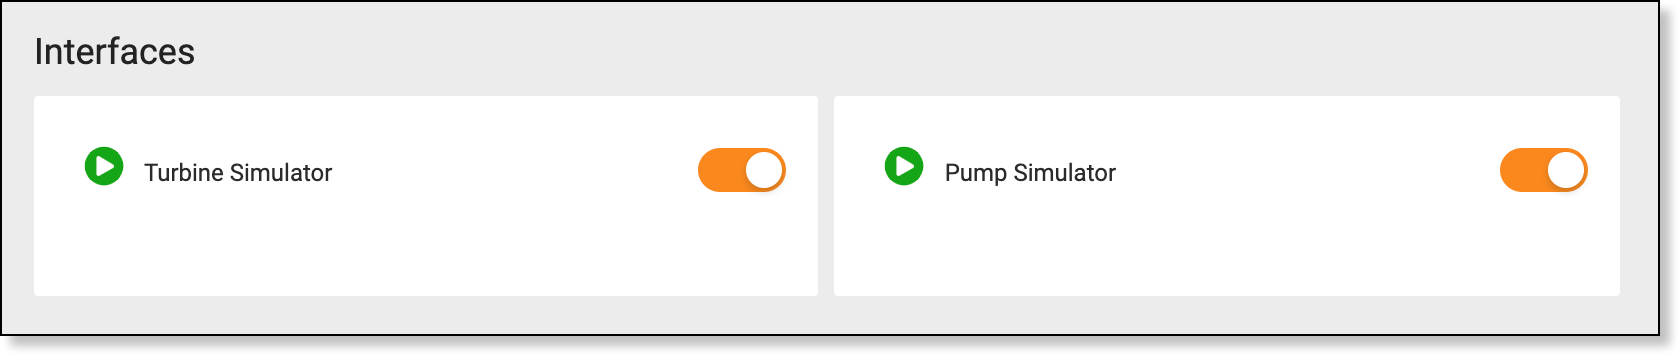
The color of an interface icon indicates the current status of its connection to Arundo Edge:
| Icon Color | Status |
|---|---|
| Green | Enabled and working |
| Red | Enabled but not working |
| Gray | Disabled |
Toggle the slider control next to an interface to enable/disable it.
Information Panel
The Information panel displays real-time performance metrics for Arundo Edge and its components.
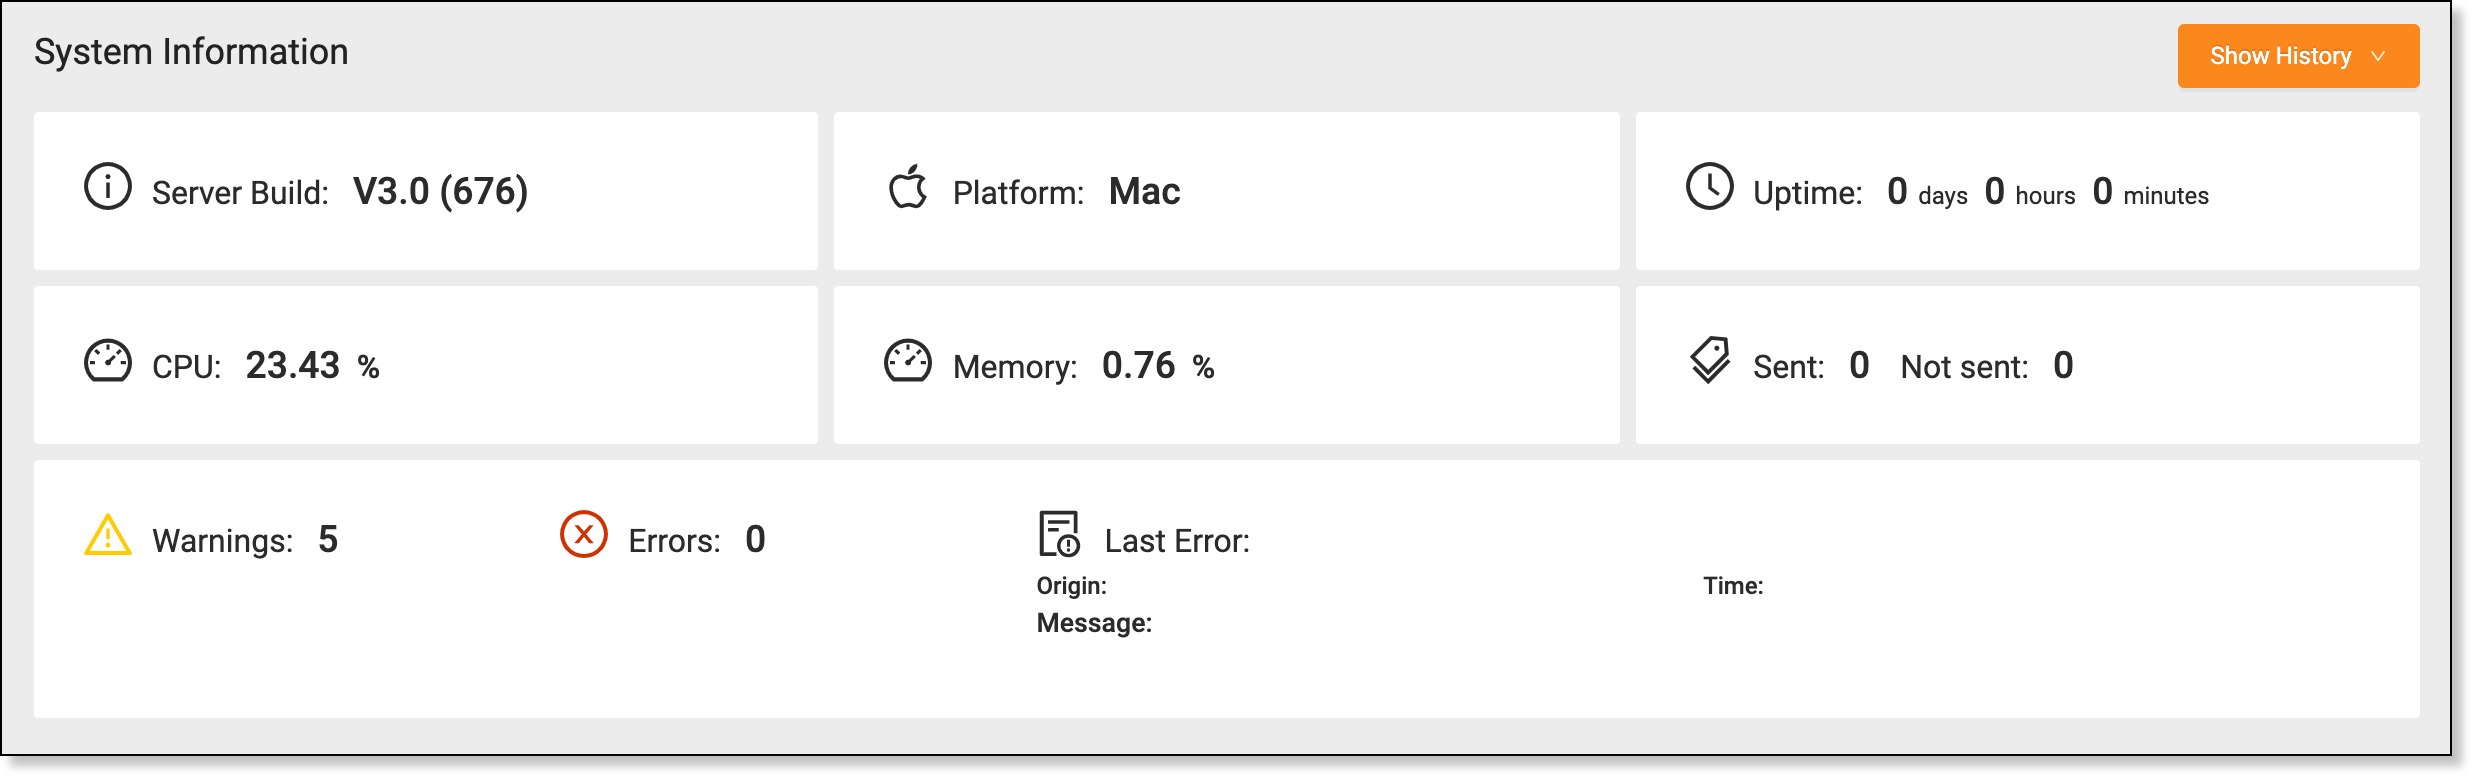
The metrics are grouped by component to make analyzing performance easier.
The System metrics display performance data for the Arundo Edge application:
| Metric | Description |
|---|---|
| Edge version | Version currently installed |
| Platform | Not used |
| Uptime | Time elapsed since the Arundo Edge service was last started |
| CPU | CPU usage by the Arundo Edge service |
| Memory | Memory usage by the Arundo Edge service |
| Sent | Number of tags sent to Arundo Fabric |
| Not sent | Number of tags stored locally and not yet sent to Arundo Fabric |
| Warnings | Number of warnings generated |
| Errors | Number of errors generated |
| Last Error | Origin, time, and message for the last error generated |
| Performance Graph | Comparison of CPU usage, memory usage, and unsent tags since the Arundo Edge service was last started |
The Agent metrics display performance data for Arundo Edge components:
| Metric | Description |
|---|---|
| CPU | CPU usage |
| Memory | Memory usage |
| Restart Count | Number of times restarted |
| Last Restart | Date and time of the last restart |
| Performance Graph | Comparison of CPU usage and memory usage |
Last update: June 15, 2020